Value Driver tree: From silos to shared goals

The roadmap for data-driven transformation
The ePaper shows you strategies, success stories and a checklist for a direct start into the digital future.

1. Introduction: The End of Departmental Warfare
In many mid-sized company boardrooms, I see the same picture: Marketing celebrates rising click rates while Sales complains about shrinking margins. IT optimizes infrastructure costs while the executive team asks about EBITA. Everyone has their own numbers – but no one speaks the same language or shares a goal that unites them all.
As an Interim Lead in data transformations, I see that reports often only show the "rearview mirror." Executives rely on lagging financial indicators like revenue or EBIT. The problem: When these numbers hit the table, the race is already over. Worse still: Each department interprets the numbers differently.
The truth: The biggest obstacle in data transformations isn't technology, but the lack of agreement on what actually matters. The Value Driver Tree is our preferred tool at The Data Institute to pull departments out of their silos and align them around a common vision. It's not a calculation model for controllers – it's a political instrument for leaders.
2. Definition: What is a Value Driver Tree?
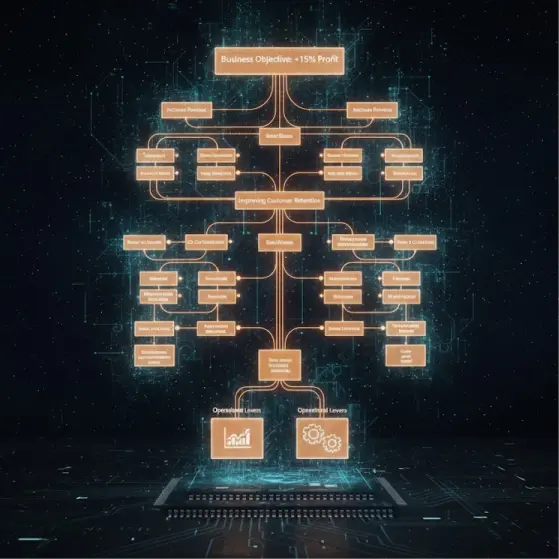
The Value Driver Tree is a central instrument of value-based corporate management and the missing link between operational hustle and strategic financial goals. It's a mathematical-logical model that visualizes cause-and-effect relationships – and thereby objectifies discussions.
Instead of talking abstractly about "digitalization" or "synergies," the Value Driver Tree breaks down an overarching goal (e.g., enterprise value, ROCE, or EBIT) into its smallest, influenceable components. Each department then sees how their work contributes to the company's bottom line.
Origin and Development
- Historical Foundation: The concept builds conceptually on the classic DuPont Model from the 1920s, which popularized the breakdown of profitability metrics (e.g., ROI) into their drivers.
- Modern Evolution: Today's Value Driver Trees have been significantly developed for Shareholder Value and Value-Based Management approaches and are often not strictly hierarchical structures, but networks of dependencies – one variable can influence both revenue and costs simultaneously.
Distinction from Classic Dashboards
A conventional dashboard merely shows you what happened. A Value Driver Tree goes three steps further:
1. It shows you why it happened (root cause analysis)
2. It makes transparent what will happen if you turn a specific lever (scenario analysis)
3. It creates a shared mathematical logic that all departments must agree upon
The crucial difference for you as a leader: The Value Driver Tree forces Marketing, Sales, and IT to agree on this shared logic. In my interim mandates, I use it as a governance instrument for driver-based planning and budgeting. When discussions become emotional ("We need more budget!"), I bring out the tree: "Show me in the model where your lever moves EBIT."
The discussion about the assumptions and dependencies in the model – where the real issues lie – is often more important than the tool itself.
3. The Mechanics: From Departmental Goals to a Common North Star
The Value Driver Tree translates strategic goals into operational levers – and makes transparent how the work of individual teams interconnects.
The logic is clear: Revenue isn't simply a number, but the product of Traffic × Conversion Rate × Average Order Value. But here's where it gets interesting:
- Hierarchy of Responsibility: Top management controls EBIT (Level 1), Marketing controls Conversion Rate (Level 3), and IT controls infrastructure costs (Level 4). The tree makes transparent how the subscriber rate in Marketing directly contributes to the company result – and thus why the IT request for a new CRM system suddenly becomes a priority.
- The Political Killer Feature: The Value Driver Tree ends the usual resource battle. Instead of each department selling their projects as "strategically important," everyone sees in the model which lever has the greatest impact. The discussion about where the real issues lie is more important than the tool itself.
Lagging vs. Leading Indicators: The Paradigm Shift
The fundamental difference lies in controllability. As a leader, you need both perspectives:
At babymarkt.de, we achieved a 60% reduction in data inconsistencies by focusing on leading indicators like data quality and process automation – which directly translated into more reliable forecasts and ultimately higher conversion rates. The key was that Marketing and Logistics understood for the first time how their data quality influenced average order value. Read more in the case study.
4. The Role of Data Governance: Trust is the Currency
The best simulation is useless if no one trusts the underlying data. This is where most initiatives fail: They delegate data quality to IT – and wonder why Sales continues working with Excel.
Poor data quality isn't a technical problem, it's a leadership problem.
- Governance as the Foundation for Collaboration: Data Governance isn't bureaucracy, but the insurance that your teams mean the same numbers when they say "revenue." It requires clear roles like Data Owners in business units who stand accountable for the content accuracy of their data values.
- Psychological Safety Instead of Data Dictatorship: In my interim mandates, my job is to alleviate fears of transparency. I show teams that data doesn't replace their experience, but validates it. This is change management, not IT management. Often, communication and empathy are more important than SQL skills.
At MediaPrint, the introduction of Data Stewards and Data Owners led to an 87% reduction in manual reporting efforts – because data quality was secured at the source, not retroactively in IT. The crucial point: Editorial staff finally understood why their metadata was relevant for advertising revenue, and collaboration was significantly optimized. The Value Driver Tree made this connection visible.
5. Implementation: Silos are a Leadership Problem, Not an IT Ticket
Implementation of such control models often fails due to "speechlessness" between departments. Technology alone doesn't break down silos. It requires a neutral leadership authority unburdened by internal politics to bring relevant stakeholders to the table.
My Role as Interim Lead: The Bridge Builder
As an Interim Leader, I don't just take on planning, but responsibility for execution. My task isn't to program the interface, but to anchor the common vision (North Star) that Sales, Marketing, and Editorial can rally behind.
The Process in Three Steps:
- Step 1: Start Visually – Without Software: Don't buy a tool immediately. Start with a whiteboard or Miro. Map the dependencies together. The deliberately "painful" process of manually gathering the numbers immediately reveals where silos and definition problems lie. These conflicts must be put on the table – the Value Driver Tree is the vehicle for that.
- Step 2: Establish the Data Governance Council: The Value Driver Tree needs a body that maintains it and moderates conflicts. In my mandates, I establish a Data Governance Council with representatives from all relevant areas – not as a rubber-stamp committee, but as a place for strategic confrontation.
- Step 3: Quick Wins as Proof of Trust: Nothing convinces skeptics more than measurable success in the first 12 weeks. At Parfümerie Pieper, we achieved a 65% reduction in report creation time through automation of a painful report. That opened doors for the larger governance topics.
Our Proven Roadmap: The "Iteration First" Approach
My proven approach reduces planning phases from months to weeks through structured Quick Wins – but with clear focus on sustainable anchoring:
Data Governance is a continuous process, not a one-time initiative. Quick Wins are important for getting started and gaining acceptance in the organization, but real governance requires stamina and perseverance. I accompany companies over quarters to ensure that old habits don't return after the initial euphoria.
This roadmap has proven successful in over 10 mid-sized company projects and prevents the classic "Big Bang" trap that causes 70% of all BI projects to fail.
6. Case Study: MediaPrint – From Silo Thinking to Shared Compass
In MediaPrint's transformation, the biggest hurdle wasn't technology, but the decades-long habit that Editorial, Advertising Sales, and Distribution each had "their own numbers."
The Challenge: Management recognized early that "technological change alone wouldn't be sufficient to sustainably shape the company's digital transformation." It required cultural change.
Our Intervention:
1. Value Driver Tree as Common Language: We developed a Value Driver Tree that showed how metadata from Editorial influenced advertising revenue – and thus EBITA. Suddenly it was clear why "annoying keyword tagging" was business-relevant.
2. Data Champions as Bridge Builders: The Data Champions Program – interested employees from business units who translated between their teams and the data department – achieved a 94% acceptance rate. These champions spoke the language of both worlds.
3. Clear Roles Instead of Diffuse Responsibility: The introduction of Data Stewards (responsible for data quality) and Data Owners (accountable for content accuracy) created not just clarity, but also pride: "This is my data, and I stand behind it."
The Results:
- 87% reduction in manual reporting efforts
- 94% acceptance rate in the Data Program
- Significant increase in employee satisfaction regarding "company future viability" and "meaningfulness of own work"
A senior executive summarized: "The key to success wasn't the technology, but the cultural change." The Value Driver Tree was the tool that structured and measured this change. More information and details can be found in our case studies.
7. Conclusion: Data Isn't an IT Topic – It's a Leadership Topic
The Value Driver Tree is more than an analysis tool. It's a leadership instrument that breaks down silos, objectifies conflicts, and aligns teams around a common goal. It gives you back control by reducing complexity to controllable levers – while simultaneously making transparent who is responsible for what.
Data strategies rarely fail due to lack of knowledge, but due to execution in daily operations and political rifts between departments. It requires not just a concept, but someone who enforces it – unburdened by internal politics, but with the necessary standing with management.
Looking for Not Just a Concept, but a Team That Executes?
Data strategies rarely fail due to lack of knowledge, but due to execution in daily operations and political rifts between departments.
At The Data Institute, we don't just take on planning, but responsibility. We bring your teams together, resolve conflicts through clear goals (Value Driver Tree), and anchor a data culture that lasts – with proven methods from over 10 mid-sized company projects.
Let's clarify together:
- Which three value drivers truly influence your business results
- Where your biggest silos between departments lie
- How we can support you in transformation
Schedule Expert Consultation Now
Do you know the three value drivers that really move your EBIT? And do you know which department controls them? We'll analyze this together – in 30 minutes.
Book 30-Minute Analysis – Free & Non-Binding
Do you know the three value drivers that really drive your EBIT? And do you know which department manages them? We'll analyse it together — in 30 minutes.
Book a 30-minute analysis — free of charge & without obligation
Do you know the three value drivers that really drive your EBIT? And do you know which department manages them? We'll analyse it together — in 30 minutes.
Book a 30-minute analysis — free of charge & without obligation

Do you know the three value drivers that really drive your EBIT? And do you know which department manages them? We'll analyse it together — in 30 minutes.
Book a 30-minute analysis — free of charge & without obligation
Related case studies
There are suitable case studies on this topic


Which services fit this topic?