Data vs. Gut Feeling: The Cultural Shift in Newsrooms


The roadmap for data-driven transformation
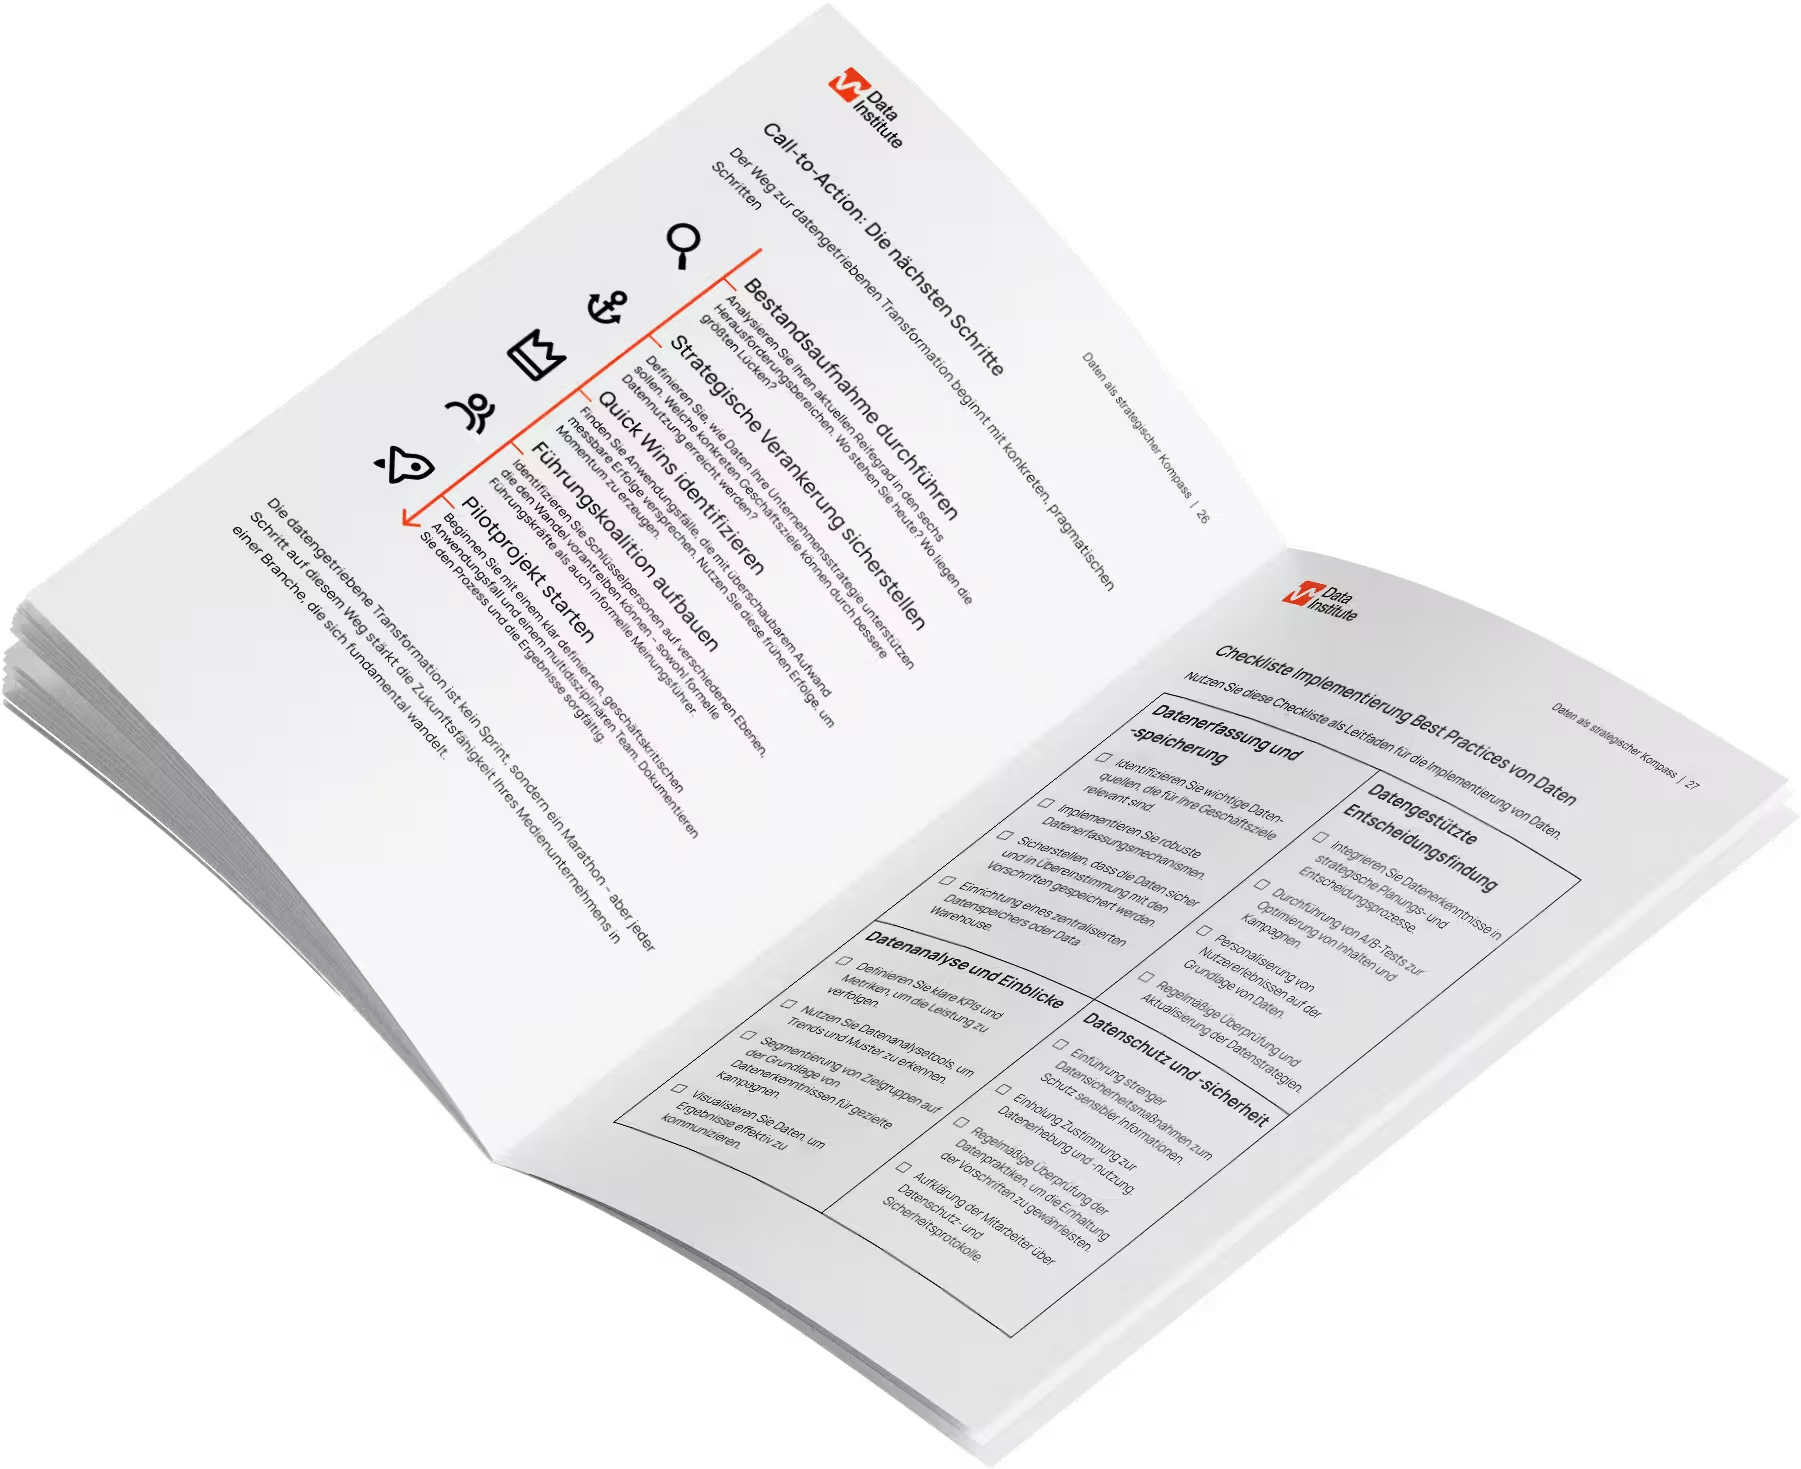
The ePaper shows you strategies, success stories and a checklist for a direct start into the digital future.
When Data Meets Tradition: The Inevitable Culture Clash
In our daily work with media companies, we repeatedly experience how deep this cultural conflict runs. The defensive attitudes toward data-driven decision-making processes typically manifest in four behavioral patterns:
- Defending the status quo: "This is how we've always done it" – a classic defense mechanism against change.
- Experience versus data: "After 20 years, I know what interests our readers" – the elevation of individual experience over systematic data analysis.
- Selective data usage: Data is only referenced when it supports one's own position.
- Complexity avoidance: The alleged impenetrability of data analysis is used as a pretext to avoid engaging with it.
These patterns are not only observed in traditional print media but also in digital newsrooms – even where extensive usage data is already available.
Understanding the Roots of Resistance
To successfully overcome resistance to data-driven decisions, we must first understand the deeper causes:
Fear of Change and Loss of Control
The psychology of change plays a central role. Every significant change triggers uncertainty and pushes people out of their comfort zone. In the editorial context, this fear encompasses several dimensions:
- Loss of autonomy: The concern that editorial independence and creative freedom could be restricted by data requirements.
- Devaluation of experience: The fear that years of expertise and journalistic craft will be devalued by algorithms and metrics.
- Uncertainty about one's own abilities: Doubts about whether one can keep pace with new technological requirements.
Misunderstandings About the Role of Data
Many journalists and editors understand data-driven decisions as a binary alternative to editorial judgment – a fundamental misunderstanding that leads to rejection.
Common misinterpretations include:
- "Data tells us what to write" (instead of: Data provides additional insights for better decisions)
- "Click rates become the sole benchmark" (instead of: Differentiated KPIs reflect various aspects of success)
- "Algorithms replace editors" (instead of: Technology supports editorial processes)
Existential Anxieties and Job Security Concerns
Especially in an industry that has been struggling with structural challenges for years, digitization and automation trigger existential concerns:
- Fear of job cuts through automation
- Concern that traditional journalistic roles will lose importance
- Worry about devaluation through performance-based evaluation systems
Successful cultural change in practice
The MediaPrint Data Strategy Transformation demonstrates how this cultural change can be successfully achieved:
Through participatory workshops with 80 people from 10 areas, it was possible to achieve a stakeholder satisfaction rating of 8.4/10 and 94% data champion
adoption – proof of successful cultural change.
The Cost of Inaction: Effects of Resistance
The consequences of ongoing resistance to data-driven decisions are far-reaching for media companies:
Slowed Innovation
A recent analysis of several European media companies showed that editorial teams that have successfully established a data-driven culture were able to introduce more than twice as many successful digital innovations as traditionally operating newsrooms. The difference was particularly evident in:
- Development speed of new digital formats
- Precision in prioritizing development resources
- Success rate when launching new products
Inefficient Resource Utilization
Without data-driven decision processes, newsrooms invest an average of 35-40% of their resources in content production with below-average engagement rates. This results in:
- Wasting scarce resources on content with low user demand
- Suboptimal personnel deployment and inefficient resource allocation
- Higher production costs per successful piece of content
Missed Monetization Opportunities
Data-oriented media companies achieve on average 42% higher conversion rates for digital subscriptions than companies that primarily rely on editorial intuition. This leads to:
- Unrecognized potential for improving user experiences
- Missed revenue opportunities due to lack of personalization
- Insufficient adaptation to changing user preferences
Declining Competitiveness
In a market environment dominated by data-driven platforms, the refusal to use data-supported decision processes represents a growing risk:
- Widening gap with digital-native competitors
- Diminishing relevance for digitally-savvy target groups
- Declining attractiveness for advertisers who expect measurable performance
Building Bridges: Successful Strategies for Cultural Change
Our experience from numerous transformation projects shows: The transition to a data-supported decision culture in newsrooms succeeds when designed as an integrative process that combines journalistic values and expertise with the possibilities of data analysis.
1. Creating Transparency: Overcoming the "Black Box" Effect
Transparency is a crucial factor for the acceptance of data-driven decision processes. Approaches that have proven effective in practice include:
- Open communication about data sources and methods: Transparency about what data is collected and how it is evaluated reduces mistrust.
- Establishment of user-friendly dashboards: Self-explanatory design and easy access to relevant metrics allow all editorial team members to understand the data basis for decisions.
- Regular "data updates": Brief, weekly meetings that provide insights into current data trends and explain their implications.
2. Sharing Success Stories: Concrete Examples Instead of Abstract Theory
Concrete success examples are more effective than theoretical explanations in persuasion work:
- "Data Success Stories": Documentation and dissemination of cases where data-driven decisions have led to measurable successes.
- Deploying internal ambassadors: Recruiting employees who have had positive experiences with data-driven methods as authentic advocates.
- Visualizing measurable success: Demonstrating the concrete benefits of data-driven decisions through before-after comparisons.
A regional newspaper, for example, was able to increase the conversion rate for digital subscriptions by 37% through targeted analysis of reader interaction data. The responsible editors reported on this in internal workshops and became convincing ambassadors for the data-driven approach.
3. Offering Training and Workshops: Empowerment Instead of Expert Dictates
A key success factor is the democratization of data knowledge through accessible educational offerings:
- Modular training programs: Offerings for different knowledge levels, from "Data Basics" to advanced analysis methods.
- Target-group-specific formats: Adapting content to the needs of different departments (e.g., editorial, marketing, product development).
- Hands-on workshops: Practical exercises with real data from the company itself.
4. Initiating Pilot Projects: Proof on a Small Scale
Successful pilot projects are particularly effective catalysts for cultural change:
- Aiming for quick wins: Selecting projects that can deliver measurable results within 2-3 months.
- Providing adequate resources: Ensuring sufficient time and budget for the employees involved.
- Forming multidisciplinary teams: Bringing together experts from editorial, data analysis, and product development.
5. Ensuring Management Support: Leading by Example Instead of Lip Service
The probability of successful cultural change increases significantly when top management actively serves as a role model:
- Consistent data-driven decision-making: Leaders should lead by example and base their own decisions on data.
- Regular communication of the vision: Clear messages about why the change is necessary and what goals are being pursued.
- Recognition and reward: Publicly acknowledging and rewarding employees who successfully implement data-driven approaches.
Practical Tip: Change Management Toolkit for Data-Driven Transformation
Based on our experiences, we have developed a practical toolkit that can support media companies in data-driven transformation:
1. Stakeholder Mapping
Identify the most important stakeholders and their attitude toward data-driven transformation:
- Supporters: Who can be recruited as ambassadors?
- Skeptics: Who has legitimate concerns that need to be addressed?
- Blockers: Who might actively resist?
2. Communication Plan
Develop a clear, consistent communication strategy:
- Core messages: Formulate concise messages that clarify the benefits of the transformation
- Communication channels: Determine the most effective ways to reach different target groups
- Timeline: Plan regular updates and success reports
3. Training Roadmap
Create a structured plan for building data competency:
- Needs analysis: Determine the current state of knowledge and training needs
- Modular offerings: Develop tiered training modules for different target groups
- Success metrics: Define how the success of training measures will be measured
4. Pilot Project Canvas
Define clearly outlined, successful pilot projects:
- Goals and KPIs: What should be achieved and how will success be measured?
- Resource plan: What people, time, and budgets are needed?
- Communication plan: How will progress and successes be communicated?
5. Feedback Mechanisms
Establish continuous feedback loops:
- Regular retrospectives: What works well, what doesn't?
- Adaptation mechanisms: How are lessons from feedback translated into improvements?
- Success metrics: Define how the progress of cultural change will be measured
Conclusion: Finding the Balance – Combining Data and Journalistic Expertise
The transition to a data-supported decision culture in newsrooms is not a binary process – it's not about "data instead of gut feeling," but about "data and experience." The most successful media companies have recognized that the combination of journalistic expertise and systematic data analysis offers the real competitive advantage.
Cultural change requires time, patience, and a deep understanding of the underlying fears and concerns. But the investment is worth it: Media companies that successfully master this transformation are not only more economically successful but also create a future-proof environment where journalistic quality and data-driven innovation go hand in hand.
Related Articles in our series on data-driven strategies for media companies
- Data as a Strategic Compass: Learn how to effectively use data as a navigation aid for strategic decisions. With practical tips and success stories from the media industry.
- Garbage In, Garbage Out: Why data quality and integration are the crucial foundations of any digital strategy – and how to ensure them in your media company.
- Data Protection as a Competitive Advantage: How to balance data protection and personalization to develop a strategic advantage for your publishing house or media company.
- Bridges Instead of Walls: How Media Companies Overcome Data Silos: This article shows how publishers and media companies can overcome their data silos and increase their competitiveness.
- Becoming a Talent Magnet: Successfully Attracting Data Talent: Examines requirements, competitive disadvantages, and presents concrete solutions for how media companies can become attractive employers for data talent.
- Data vs. Gut Feeling: The Cultural Shift in Newsrooms How media companies can successfully manage the cultural transition to data-driven decision-making.
- The Path to a Data-Driven Media Organization: A Roadmap: Findings from the series of articles in which various facets and challenges were examined.
Would you like to learn more about this topic? Subscribe to our newsletter to receive more articles from our data competence series. Contact us at contact@datainstitute.io or schedule an appointment for individual consultation on overcoming data silos in your media company.
Picture Anastasiia Ornarin on unsplash
Relevante News einmal im Monat?
Einfach unseren Newsletter abonnieren
Relevante News einmal im Monat?
Einfach unseren Newsletter abonnieren

Relevante News einmal im Monat?
Einfach unseren Newsletter abonnieren
Related case studies
There are suitable case studies on this topic


Which services fit this topic?